Usage as a Python package
LaTeX classes
You can create TikZ pictures using two available classes:
TexDocument(code, **options): Uses a full LaTeX document as code input (same effect as-as=full-document).TexFragment(code, **options): Uses part of a LaTeX document as code input to create a standalone LaTeX document (same effect as-as=standalone-documentor-as=tikzpicture).
For more details, please visit the API reference.
Usage of TexDocument
First, let's import the TexDocument class from the package:
from jupyter_tikz import TexDocument
code = r"""\documentclass{standalone}
\usepackage{graphicx}
\usepackage{tikz}
\usepackage{amsfonts}
\usetikzlibrary{quotes,angles}
\begin{document}
    \scalebox{2}{
    \begin{tikzpicture}
        % Example from Paul Gaborit
        % http://www.texample.net/tikz/examples/angles-quotes/
        \draw
            (3,-1) coordinate (a) node[right] {a}
            -- (0,0) coordinate (b) node[left] {b}
            -- (2,2) coordinate (c) node[above right] {c}
            pic["$\alpha$", draw=orange, <->, angle eccentricity=1.2, angle radius=1cm]
            {angle=a--b--c};

        \node[rotate=10] (r) at (2.5, 0.65) {Something about in $\mathbb{R}^2$};
    \end{tikzpicture}
    }
\end{document}"""
And create the tex_document object(1):
- You can obtain the code by printing the object.
tex_document = TexDocument(code)
print(tex_document)  # To print the object displays the code
\documentclass{standalone}
\usepackage{graphicx}
\usepackage{tikz}
\usepackage{amsfonts}
\usetikzlibrary{quotes,angles}
\begin{document}
    \scalebox{2}{
    \begin{tikzpicture}
        % Example from Paul Gaborit
        % http://www.texample.net/tikz/examples/angles-quotes/
        \draw
            (3,-1) coordinate (a) node[right] {a}
            -- (0,0) coordinate (b) node[left] {b}
            -- (2,2) coordinate (c) node[above right] {c}
            pic["$\alpha$", draw=orange, <->, angle eccentricity=1.2, angle radius=1cm]
            {angle=a--b--c};

        \node[rotate=10] (r) at (2.5, 0.65) {Something about in $\mathbb{R}^2$};
    \end{tikzpicture}
    }
\end{document}
Run LaTeX
Finally, run LaTeX and display the output(1):
- You can configure the output by passing options to
run_latex. In this example,save_imageandsave_tikzwere used.
tex_document.run_latex(save_tikz="outputs/angle", save_image="outputs/angle")

The output image and code will be saved in:
.
└─ outputs/
   └─ angle.svg
   └─ angle.tikz
Working with Jinja
You can render Jinja by simply creating an object with Jinja code.
Firstly, let's create a Jinja template:
jinja_code = r"""\documentclass[tikz]{standalone}
\usetikzlibrary{arrows,automata}
\definecolor{mymagenta}{RGB}{226,0,116}
\begin{document}
\begin{tikzpicture}[->,>=stealth',shorten >=1pt,auto,node distance=2.8cm,
                    semithick]
  \tikzstyle{every state}=[fill=mymagenta,draw=none,text=white]

  {% for name, angle in nodes.items() -%}
       \node[color=mymagenta] (v{{loop.index0}}) at ({{angle}}:1) {${{name}}$};
  {% endfor -%}

  {% for n1 in range(n) -%}
      {% for n2 in range(n) -%}
         {%if n1 < n2 -%}
             \path (v{{n1}}) edge (v{{n2}});
         {% endif -%}
      {% endfor -%}
  {% endfor -%}
\end{tikzpicture}
\end{document}"""
Then, pass the jinja_code into the creation of the TexDocument (1):
- You must pass the
ns=<namespace>parameter in other to allow the method to access the variable.
tex_jinja_document = TexDocument(jinja_code, ns=locals())
print(tex_jinja_document)  # It prints the rendered Jinja Code
\documentclass[tikz]{standalone}
\usetikzlibrary{arrows,automata}
\definecolor{mymagenta}{RGB}{226,0,116}
\begin{document}
\begin{tikzpicture}[->,>=stealth',shorten >=1pt,auto,node distance=2.8cm,
                    semithick]
  \tikzstyle{every state}=[fill=mymagenta,draw=none,text=white]

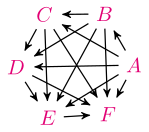
  \node[color=mymagenta] (v0) at(0:1) {$A$};
  \node[color=mymagenta] (v1) at(60:1) {$B$};
  \node[color=mymagenta] (v2) at(121:1) {$C$};
  \node[color=mymagenta] (v3) at(182:1) {$D$};
  \node[color=mymagenta] (v4) at(243:1) {$E$};
  \node[color=mymagenta] (v5) at(304:1) {$F$};


  \path (v0) edge (v1);
  \path (v0) edge (v2);
  \path (v0) edge (v3);
  \path (v0) edge (v4);
  \path (v0) edge (v5);
  \path (v1) edge (v2);
  \path (v1) edge (v3);
  \path (v1) edge (v4);
  \path (v1) edge (v5);
  \path (v2) edge (v3);
  \path (v2) edge (v4);
  \path (v2) edge (v5);
  \path (v3) edge (v4);
  \path (v3) edge (v5);
  \path (v4) edge (v5);

\end{tikzpicture}
\end{document}
Finally, run LaTeX and show the output:
tex_jinja_document.run_latex(rasterize=True, dpi=150)
Usage of TexFragment
If you want to use parts of LaTeX, you can use the TexFragment class.
Tip
TexFragment is a subclass of TexDocument, which means that all methods available in TexDocument are also available in TexFragment.
Now follows a basic example:
# The code
tex_template_code = r"""\begin{axis}[
  xlabel=$x$,
  ylabel={$f(x) = x^2 - x +4$}
]
\addplot {x^2 - x +4};
\end{axis}"""

# The tikz object
tikz_picture = TexFragment(
    tex_template_code,
    implicit_tikzpicture=True, # If true wraps the template within a tikzpicture
    scale=1.5,
    tex_packages="pgfplots",
    no_tikz=True
)

# Run LaTeX
tikz_picture.run_latex()
